In my previous post I used newspaper archives to determine and describe the types of traffic I thought Vernon River would normally see.
My goal is now to not only determine the amount of freight traffic Vernon River would see but to also determine the average train length, loads and percentage of originating vs terminating traffic on the Murray Harbor subdivision as a whole. Having these statistics will allow me to accurately model the car movement both through and at Vernon River.
This info is important for a few reasons, but mainly I need to be able to:
- Determine in general terms the amount of switching moves per operating session
- Determine to the average train length through Vernon River
- Determine the usual ratio of originating to terminating cars
- Use the above information to figure out how long the single track staging cassette will need to be on each side of the layout.
With the new Drive-By Truckers record on in the background, into the rabbit hole I went.
In my files I found a summary written by Shawn Naylor of a freight report CN completed in the early 1960s. Apparently this report was prepared to propose reductions in PEI’s rail service. In the report CN used carload data from the mid to late 1950s which makes it super conveniently accurate for my layout’s era.
Below I’ve created a spreadsheet of carload data as it applies to the Lake Verde, Vernon [Loop] and Murray Harbor subdivisions from this summary (the same mixed train #240N / #209S served these subdivisions.)
1958 Daily Carload Data: Lake Verde, Vernon [Loop], Murray Harbor Subdivisions
STATION | ORIGINATING CARLOAD / DAY | TERMINATING CARLOAD / DAY | TOTAL |
| Millview | 0.4 | NIL | 0.4 |
| Vernon [Loop] | 0.5 | 1.0 | 1.5 |
| Murray Harbor | 0.1 | 0.1 | 0.2 |
| Mount Albion | 0.6 | NIL | 0.6 |
| Other Lake Verde, Vernon and Murray Harbor Subdivision Stations | 2.0 | 0.7 | 2.7 |
| TOTAL | 3.6 | 1.8 | 5.4 |
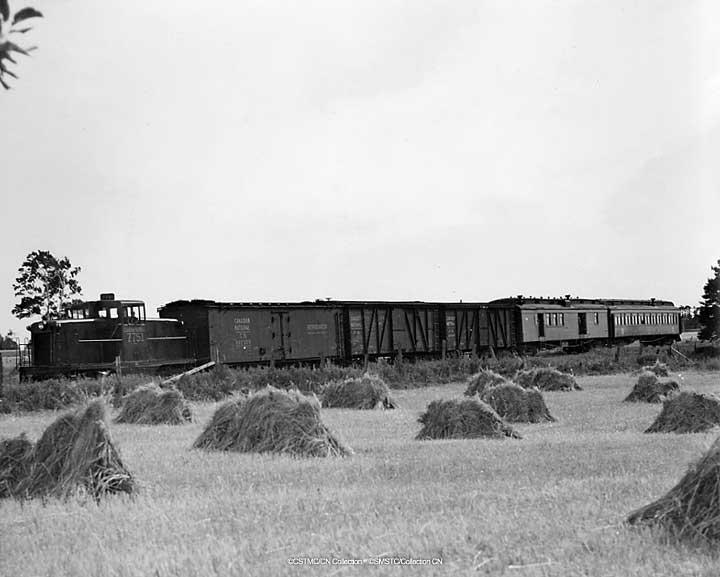
Using the numbers on the chart it would be fair to say the average train could include around five freight cars- a pretty low key operation. Most photos I’ve seen reinforce this, showing on average zero – three freight cars plus the baggage and coach car. [With a train so small I should be able to get away with a 5ft staging cassette on each side of the layout]. Obviously not all of these cars would be destined for Vernon River. In fact, it probably wasn’t a daily occurrence that anything would even be switched there. For the sake of fun, my layout will only operate on days where there is an originating or terminating load for Vernon River.
Knowing the average train length I now need to know what types of freight we’d see on that train. Naylor’s summary includes traffic types for the Murray Harbor, Lake Verde and Vernon [Loop] subdivisions but the figures are irrevocably lumped together with the Montague and Georgetown subdivisons. I can live with that though- the Montague and Georgetown subdivisions would have seen pretty similar types of traffic. It shouldn’t distort our reality too much.
1958 Originating vs Terminating Carloads: Murray Harbor, Vernon [Loop] & Lake Verde Subdivisions:
- Originating Carloads: 67%
- Terminating Carloads: 33%
1958 Originating Carloads: Murray Harbor, Vernon [Loop], Lake Verde, Montague and Georgetown Subdivisions:
- Potatoes: 57%
- Turnips: 33%
- Other: 9%
- Livestock: 1% (Aprox 13 carloads per year)
1958 Terminating Carloads: Murray Harbor, Vernon [Loop], Lake Verde, Montague and Georgetown Subdivisions:
- Other: 54%
- Sand and Gravel: 27%
- Fertilizer: 13%
- Coal and Coke: 3% (Aprox 30 carloads per year)
- Animal Feed: 2% (Aprox 27 carloads per year)
- Petrol Products: 1% (Aprox 9 carloads per year)
In Naylor’s summary is it said that a contributing factor to PEI’s high operating costs was the need to use different cars for originating and terminating traffic; cars used to import things to the Island tended to leave empty. As such, local moves will range from very rare to non-existent on this layout.
With these statistics I now have a great foundation to base my layouts operations around. Even though I’m only modelling a single village, I think its important to consider the subdivision as a whole in order to serve my chosen village accurately.
Now I just need to figure out how to work these averages and percentages into a car card system…
CM
